Evolution of the business

+2.3 million new credit cards, 16.4% more than in 2022.
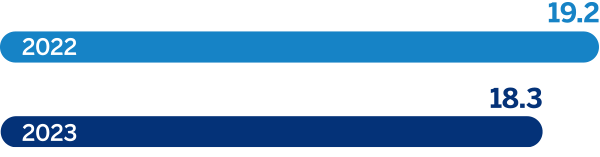
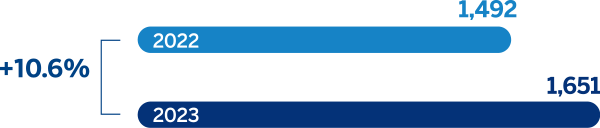
Total Performing Portfolio
(billion pesos)
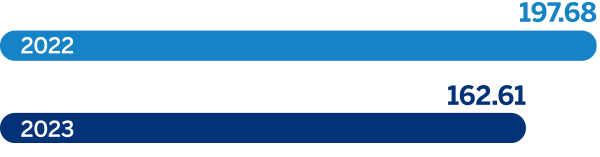
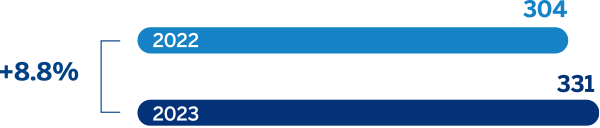
Mortgage Portfolio
(billion pesos)
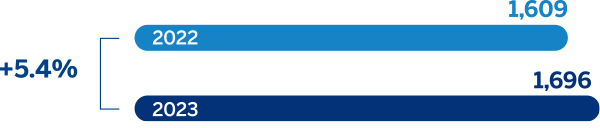
Bank Deposits
(billion pesos)
75% of the commercial loan portfolio corresponds to the corporate segment segment and 25% to the government and financial institutions segments.
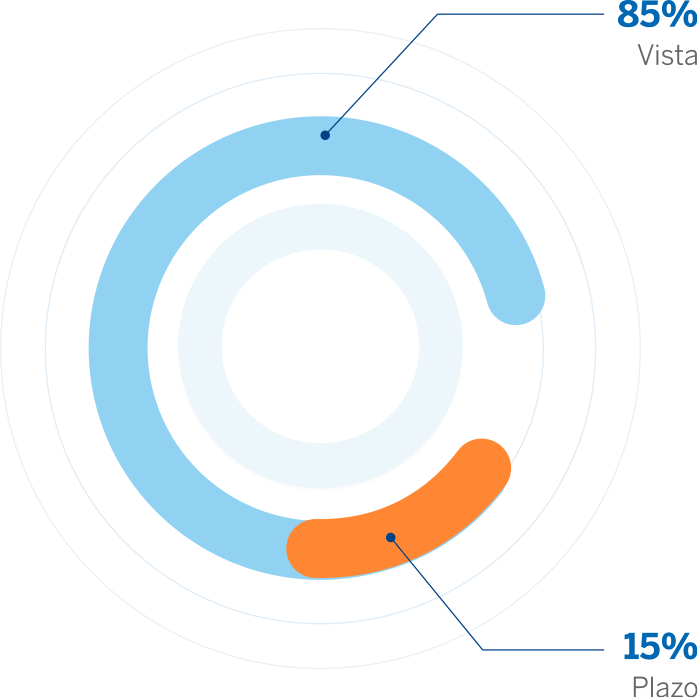
Composition of Bank Deposits
(%)